Adverse Drug Reaction Alert - gene

Read Me

Adverse drug reaction

An adverse drug reaction (ADR) is described by the World Health Organization (WHO) as "a response to a medicine which is noxious and unintended, and which occurs at doses normally used in man" [1].

Significant gene

A significant gene set, that is a gene expression signature, can be simply described as "the list of genes differentially expressed in any biological distinction" [2].

Frequency threshold

Above the frequency (or probability) threshold of 0.001, about 65% of newly predicted ADRs that haven't been documented were excluded. These undocumented ADRs were taken as "false positives"; however, many of them were actually so rare that only one or a few cases were reported. By setting a frequency threshold, the possible "false positives" can, to some extent, be largely reduced. A higher estimated frequency of, e.g., 0.001 will help to exclude majority of those very rare ADRs.

ADR frequency categories

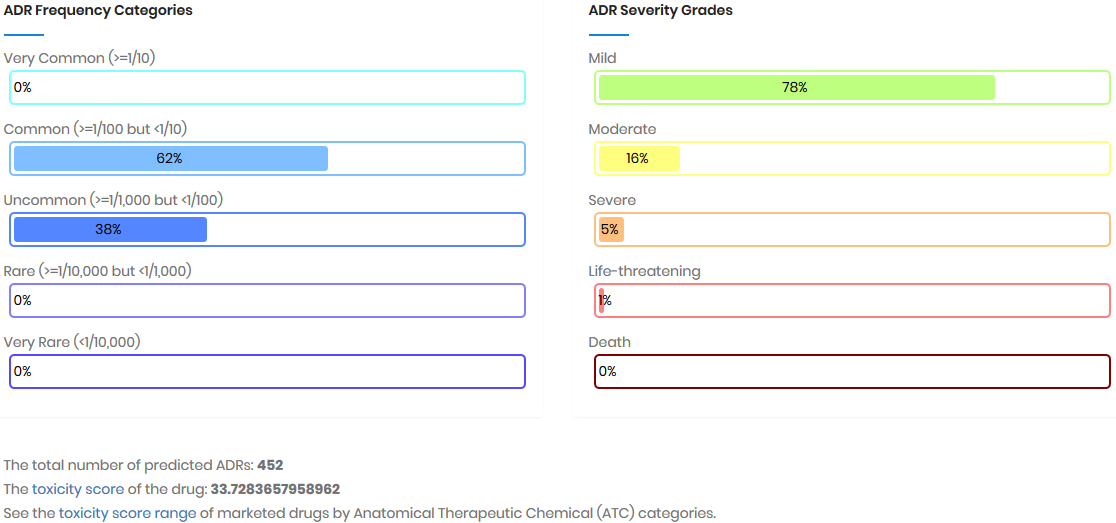
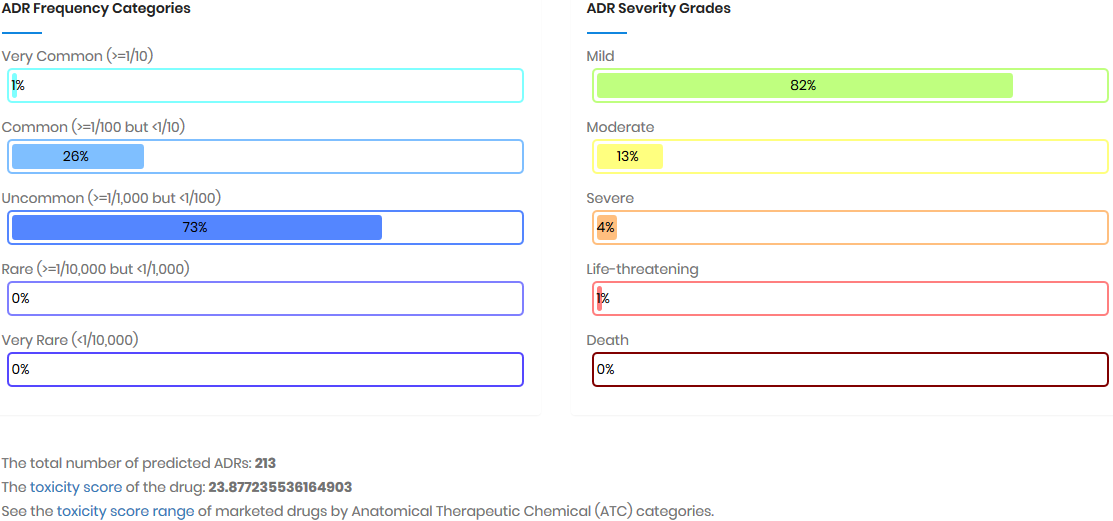
The U.S. Food and Drug Administration (FDA) classifies ADRs in various ways. An ADR classification scheme is based on frequency of the occurrence of a particular drug-induced reaction. In clinical practice, the ADRs are usually categorized into five groups: very common (>=1/10), common (>=1/100 but <1/10), less common (>=1/1,000 but <1/100), rare (>=1/10,000 but <1/1,000) and very rare (<1/10,000) [3].

ADR severity grades

we pre-assigned ADRs into five severity categories of mild, moderate, severe, life threatening or death according to the Common Terminology Criteria for Adverse Events (CTCAE) [4]. The CTCAE is a predominant system for describing the severity of adverse events (AEs) commonly encountered in clinical trials. The CTCAE displays Grades 1 through 5 with unique clinical descriptions of severity for each AE based on this general guideline:
  • Mild (Grade 1; score=1): Asymptomatic or mild symptoms; clinical or diagnostic observations only; intervention not indicated.
  • Moderate (Grade 2; score=10): Minimal, local or noninvasive intervention indicated; limiting age-appropriate instrumental ADL*.
  • Severe (Grade 3; score=100): Severe or medically significant but not immediately life-threatening; hospitalization or prolongation of hospitalization indicated; disabling; limiting self care ADL**.
  • Life-threatening (Grade 4; score=1000): Life-threatening consequences; urgent intervention indicated.
  • Death (Grade 5; score=10000): Death related to ADR.
Activities of Daily Living (ADL)
*Instrumental ADL refer to preparing meals, shopping for groceries or clothes, using the telephone, managing money, etc
**Self care ADL refer to bathing, dressing and undressing, feeding self, using the toilet, taking medications, and not bedridden.

Drug-ADR relations

We derived the drug-ADR relations from the Adverse Drug Reaction Classification System (ADReCS, http://www.bio-add.org/ADReCS) [5], which is a comprehensive ADR ontology database that provides both standardization and hierarchical classification of ADR terms. Current model only includes the U.S. FDA-approved drugs and ADR high level terms (HLTs) documented for drugs.

Drug-gene relations

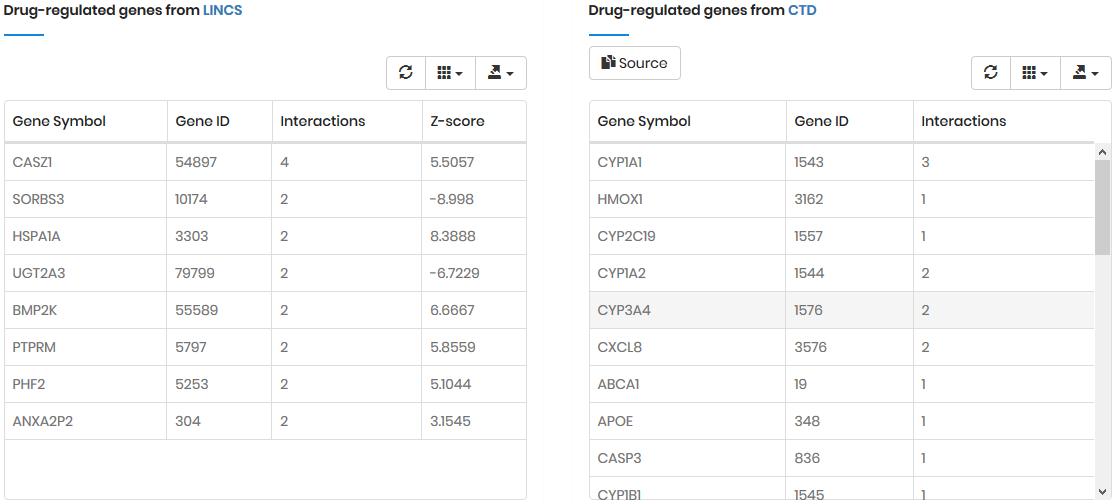
We derived the drug-gene relations from the Library of Integrated Network-based Cellular Signatures (LINCS, http://www.lincsproject.org) [6], which is a massive-scale “library” of gene expression signatures across multiple cell and perturbation types. It determines how perturbations like drug treatment affect gene expressions. We obtained normalized gene expression profiles (Z-score) from 14 cell line experiments treated with 365 U.S. FDA-approved drugs at a concentration of 10 μM for 6 hours. For each drug treatment, differentially expressed genes with the moderated Z-scores >= 2 or Z-scores <= -2 over at least two experiments were taken as reliable signature genes for the drug (i.e., drug-regulated genes). For modeling, we only chose those consensus drug-gene pairs that had same regulation direction (up-regulated or down-regulated) in all experiments. Besides, we defined the regulation strength of a consensus drug-gene regulation pair as the maximum positive value of Z-scores for up-regulation and the minimum negative value of Z-scores for down-regulation in all experiments. Other than LINCS, drug-gene relations of Homo sapiens deposit in the Comparative Toxicogenomics Database (CTD, http://ctdbase.org) [7] were also collected, however, not for modeling but as reference for drug-gene relations.

Gene-gene relations

We obtained the gene-gene relations and their interaction strength from the GeneMANIA Cytoscape plugin [8], which measures gene-gene relations using a guilt-by-association approach over publicly available biological big data. The big data include multiple molecule interaction networks of protein-protein, protein-DNA, genetic interactions, pathways, co-expression, co-localization and protein domain similarity from multiple organisms. We adopted all Homo sapiens interaction networks to quantitatively measure the gene-gene relations and incorporated those relations with weight >=0.001 into the model.

ADR-ADR concurrence

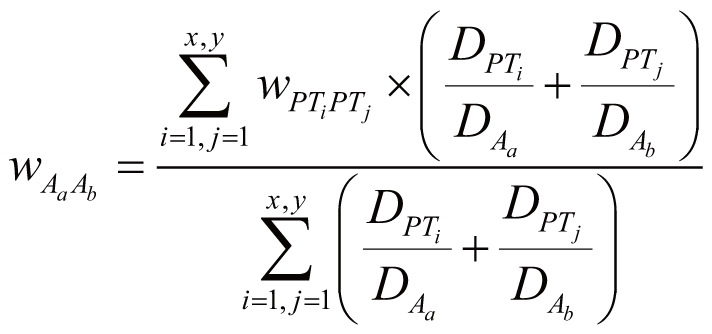
We calculated the concurrence, denoted as w, between a pair of ADR HLTs – Aa (consisting of x Preferred Terms) and Ab (consisting of y Preferred Terms) by:
where DAa stands for the number of drugs inducing Aa, DAb stands for the number of drugs inducing Ab, DPTi stands for the number of drugs inducing Preferred Term (PT) PTi of Aa, DPTj stands for the number of drugs inducing PTj of Ab, DPTi∩PTj stands for the number of drugs inducing both PTi and PTj, DPTi∪PTj stands for the number of drugs inducing either PTi or PTj, and D stands for the total number of drugs in the model. Only ADR-ADR pairs with concurrency >=0.01 were incorporated into the model.

The weighted model triggered by single gene

In the naïve Bayesian model, the three elements were denoted as followings: the drug set D = {D1, D2, ..., Dl}, the gene set G = {G1, G2, ..., Gn}, and the ADR set A = {A1, A2, ..., Am}. For a single gene Gn (GnG), the drugs that regulate Gn (i.e., the drug-gene pair) were denoted as DGn = {D1 , D2, ..., Dq} (DGnD). Furthermore, the drugs that regulate Gn and thus induce ADR Am (AmA) were denoted as DGnAm = {D1, D2, ..., Dp} (DGnAmDGn ). Accordingly, the posterior probability of Am directly triggered by Gn (despite gene-gene regulation and ADR concurrence), denoted as P(Am |Gn), can be calculated by:
where wDiGn stands for the regulation weight (strength) between Di (DiDGnAm) and Gn, wDiAm stands for the association weight (i.e., ADR frequency) between Di and Am, wDjGn stands for the regulation strength between Dj (DjDGn) and Gn, wDjA stands for the association weight between Dj and any one of the ADRs in A.

Incorporation of gene-gene regulation and ADR concurrence

When incorporation of gene-gene regulation and ADR concurrence into the model, we denoted the genes that interact with Gn as Gassoc = {G1, G2, ..., Gs} (GassocG and GnGassoc), and the ADRs that have concurrence with Am as Aassoc = {A1, A2, ..., Ar} (AassocA and AmAassoc). Accordingly, the probability of Am triggered by Gn, denoted as P(Am|Gn)’, can be calculated by:
where wGnGi stands for the weight of Gn and Gi interaction (GiGassoc), wAmAj stands for the weight of Am and Aj concurrence (AjAassoc), and P(Aj|Gi) stands for the probability of Aj directly triggered by Gi.

The improved model triggered by multiple genes

In most cases, a drug D regulates multiple genes; these genes are denoted as gene set Gtgt = {G1, G2, ..., Gt} (GtgtG). As the result, the probability of Am triggered by Gtgt, denoted as P(Am|Gtgt)norm, can be calculated by:
if (3 <= t < 100)
if (100 <= t < 1000)
if (t >=1000)
where P(Am|Gk)’ stands for the probability of Am triggered by Gk; it can also serve as the occurrence or frequency of ADR.
The methodology
Xiang, Y.P., Liu, K., Cheng, X.Y., Cheng, C., Gong, F., Pan, J.B. & Ji, Z.L. Rapid Assessment of Adverse Drug Reactions by Statistical Solution of Gene Association Network. IEEE/ACM Trans. Comput. Biol. Bioinform. 12, 844-850 (2015).

Toxicity score

The toxicity score is a parameter designed for measuring the summarized toxicity effects induced by a drug. It evaluates the drug safety by integrating the information of both ADR occurrence and ADR severity. The toxicity score of a drug can be determined by:
where Fi stands for the estimated occurrence of ADR Ai , Si stands for the severity scores of ADR Ai , and Ai belongs to the list of ADRs {A1 , A2 , …, An } predicted for the drug.
Figure. The toxicity score range of marketed drugs by Anatomical Therapeutic Chemical (ATC) categories, calculating by observed frequency of known ADRs (A) and estimated frequency of known and potential ADRs (B), respectively.

Assess ADRs from drug


Step 1: Enter a drug name or a drug identifier like ATC code, MeSH ID and DrugBank ID in the text area.
Step 2: Set a frequency threshold (or minimum estimated ADR frequency, default 0.001) to refine the assessment results.
Step 3: Click the "Assess" button to send the job to the ADRAlert-gene server. You can ask for a sample input of drug name by clicking on the "Sample" button and clear all the settings by clicking on the "Reset" button.
Step 4: The first section of outputs provides information of drug-gene relations that ADR prediction builds on, consisting of the gene expression signatures (or differentially expressed genes) of drug treatment by mining LINCS and the drug-regulated genes extracted from CTD. You can download files containing the outputs of these two tables by clicking on the "Export" button and access to the drug-gene interaction information in CTD by clicking on the "Source" button.
Step 5: The second section of outputs gives the statistics of the predicted ADRs by occurrence and severity in two tables. The left table counts the predicted ADRs by five occurrence categories. The right table summarizes the ADRs in five severity grades: mild, moderate, severe, life-threatening and death. Subsequently, the program measures the drug safety by two parameters, the total number of ADRs and the toxicity score.
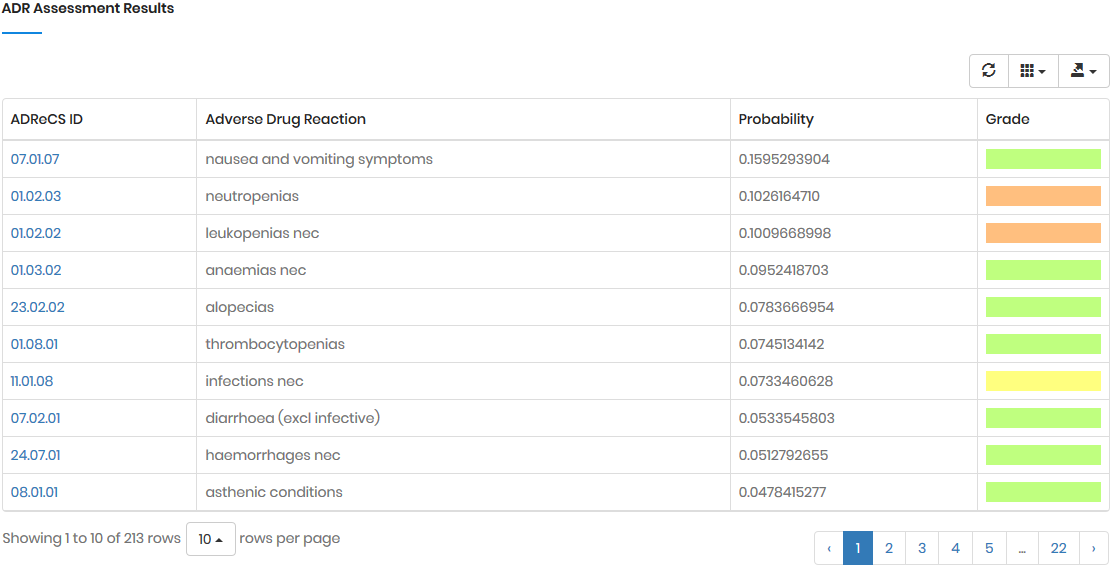
Step 6: The third section of outputs lists all the ADRs predicted by ADRAlert-gene, satisfying the preset frequency threshold. The table content presents in five columns: the ADReCS ID of ADR, the standard ADR term, the ADR status (known or predicted), the estimated ADR occurrence, and the ADR severity grade. All ADRs are displayed in a descending order of estimated occurrence by default; however, re-sorting is supported by clicking on the title of each column. The prediction result is downloadable by clicking the "Export" button at the up-right corner of the table.

Assess ADRs from gene


Step 1: Enter or copy-paste the list of drug-induced significant genes by standard human gene symbols or Entrez gene IDs in the text form, separated by comma, semicolon, space or newline. Or upload the text file containing the comma, semicolon, space or newline-delimited gene list from your local computer. Usually, a reliable safety evaluation expects at least three genes to trigger profiling.
Step 2: Set a frequency threshold (or minimum estimated ADR frequency, default 0.001) to refine the assessment results.
Step 3: Click the "Assess" button to send the job to the ADRAlert-gene server. You can ask for a sample input of gene list by clicking on the "Sample" button and clear all the settings by clicking on the "Reset" button.
Step 4: The first section of outputs gives the statistics of the predicted ADRs by occurrence and severity in two tables. The left table counts the predicted ADRs by five occurrence categories. The right table summarizes the ADRs in five severity grades: mild, moderate, severe, life-threatening and death. Subsequently, the program measures the drug safety by two parameters, the total number of ADRs and the toxicity score.
Step 5: The second section of outputs lists all the ADRs predicted by ADRAlert-gene, satisfying the preset frequency threshold. The table content presents in five columns: the ADReCS ID of ADR, the standard ADR term, the ADR status (known or predicted), the estimated ADR occurrence, and the ADR severity grade. All ADRs are displayed in a descending order of estimated occurrence by default; however, re-sorting is supported by clicking on the title of each column. The prediction result is downloadable by clicking the "Export" button at the up-right corner of the table.

Gene-ADR associations from ADR


Step 1: Enter an ADR term or ADR ADReCS ID.
Step 2: Set an association strength threshold (default 0.01) to refine the search results.
Step 3: Click the "Search" button to send the job to the ADRAlert-gene server. You can ask for a sample input of ADR ADReCS ID by clicking on the "Sample" button and clear all the settings by clicking on the "Reset" button.
Step 4: The outputs lists all the ADR-associated up-regulated genes and down-regulated genes. The search result is downloadable by clicking the "Export" button at the up-right corner of the table.


Gene-ADR associations from gene


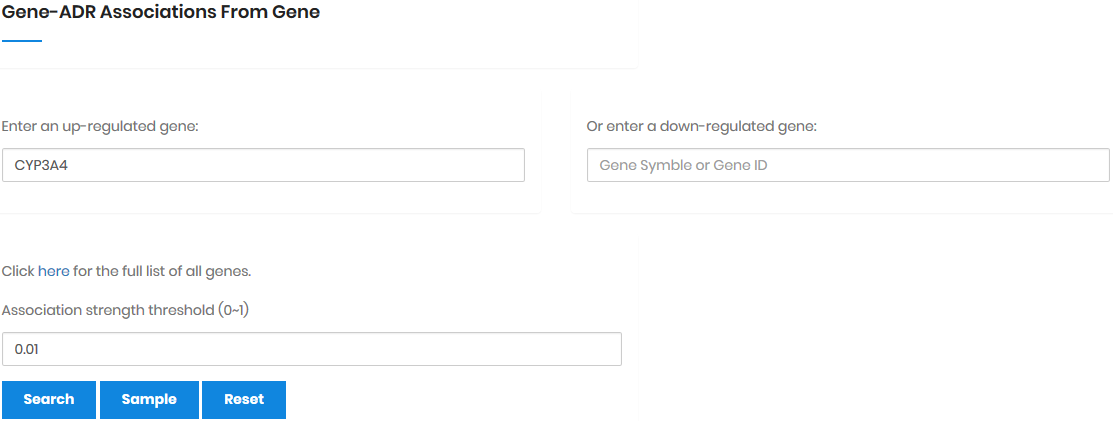
Step 1: Enter an up-regulated gene or a down-regulated gene.
Step 2: Set an association strength threshold (default 0.01) to refine the search results.
Step 3: Click the "Search" button to send the job to the ADRAlert-gene server. You can ask for a sample input of gene symbol by clicking on the "Sample" button and clear all the settings by clicking on the "Reset" button.
Step 4: The outputs lists all the gene-associated ADRs. The search result is downloadable by clicking the "Export" button at the up-right corner of the table.


Methodology

Xiang, Y.P., Liu, K., Cheng, X.Y., Cheng, C., Gong, F., Pan, J.B. & Ji, Z.L. Rapid Assessment of Adverse Drug Reactions by Statistical Solution of Gene Association Network. IEEE/ACM Trans. Comput. Biol. Bioinform. 12, 844-850 (2015).

ADRAlert-gene web server

To be updated...
  1. World Health Organization. Safety of Medicines: A guide to detecting and reporting adverse drug reactions: Why health professionals need to take action. (2002).
  2. Lamb, J. The Connectivity Map: a new tool for biomedical research. Nat. Rev. Cancer 7, 54-60 (2007).
  3. Wooten, J. Reporting adverse drug reactions. South. Med. J. 102, 345-346 (2009).
  4. National Cancer Institute. Common Terminology Criteria for Adverse Events (CTCAE) Version 4.0. (2010).
  5. Cai, M.C., Xu, Q., Pan, Y.J., Pan, W., Ji, N., Li, Y.B., Jin, H.J., Liu, K. & Ji, Z.L. ADReCS: an ontology database for aiding standardization and hierarchical classification of adverse drug reaction terms. Nucleic Acids Res. 43, D907-D913 (2015).
  6. Duan, Q., Flynn, C., Niepel, M., Hafner, M., Muhlich, J.L., Fernandez, N.F., Rouillard, A.D., Tan, C.M., Chen, E.Y., Golub, T.R., Sorger, P.K., Subramanian, A. & Ma'ayan, A. LINCS Canvas Browser: interactive web app to query, browse and interrogate LINCS L1000 gene expression signatures. Nucleic Acids Res. 42, W449-W460 (2014).
  7. Davis, A.P., Murphy, C.G., Johnson, R., Lay, J.M., Lennon-Hopkins, K., Saraceni-Richards, C., Sciaky, D., King, B.L., Rosenstein, M.C., Wiegers, T.C. & Mattingly, C.J. The Comparative Toxicogenomics Database: update 2013. Nucleic Acids Res. 41, D1104-D1114 (2013).
  8. Montojo, J., Zuberi, K., Rodriguez, H., Kazi, F., Wright, G., Donaldson, S.L., Morris, Q., & Bader, G.D. GeneMANIA Cytoscape plugin: fast gene function predictions on the desktop. Bioinformatics 26, 2927-2928 (2010).